
This article demonstrates a quick and easy approximation for the probability formulae which I described in two previous articles.
For background, see these two articles:
TL;DR
Given a desired customer facing SLO/SLA, divide the corresponding failure rate by the number of backend services which will give you a very close approximation of the failure rate that you’ll need to achieve or do better than in the backend.
The approximation is very close up to the point where the customer experience becomes so bad that they won’t notice the difference. (There likely won’t be many customers left.) Anything worse than a service level of about 90% (1 failure in 10) for the customer and the approximation starts diverging from the real formulae and becomes less useful.
Details and Examples
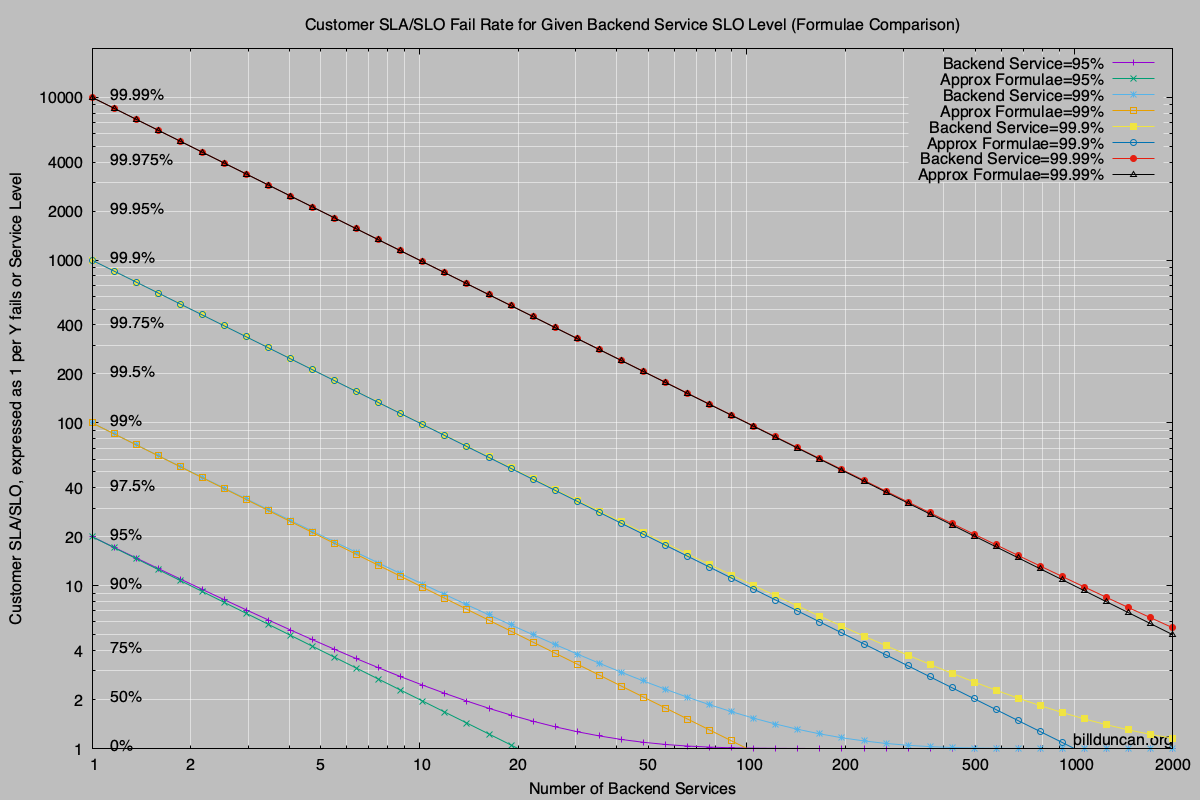
For example, take the two lines that represent 99% service level (1 failure in 100) in the backend. At 10 backend services both formulae suggest that the customer experiences 90% service level (1 failure in 10). At 100 backend services the approximation suggests that the customer experiences failures 100% of the time where in reality there is a 37% chance of success. (This is mathematically intuitive, as in reality the probable overall failure rate approaches but never quite reaches 100%.)
However, for all practical purposes where the customer experiences better than a 90% service level, the simple approximation is close enough as you can see in the graph.
Using a reasonable example, let’s say we assume customers can tolerate a success rate of 95% (1 fail in 20) and we have up to 50 services in the backend. The real probability formulae says you need better than a service level of 99.8975% (1 fail in 975.3) in the backend. The approximation gives us 1/(20*50) or 1 fail in 1000, 99.9% service level, or close enough to the actual formulae to be useful.
Probabilities will rarely ever match reality anyway, as there are so many variables that can’t be controlled. (Do all your backend services have exactly the same failure rates? No.) Nevertheless, a useful approximation to get you in the neighbourhood.
Keep in mind that the number you arrive at with either formulae specifies what you’ll need to achieve with the worst performing backend service. As an exaggerated example, say two services are required; one has a success rate of 50% and the other 90%. The overall success rate will always be worse than the worst service; in this case a success rate of 45%, or 100*0.5*0.9.
Probably..
One thought on “The Tail at Scale Approximation”
Comments are closed.