
The landmark “Tail at Scale”[1] article was missing some of the math. We’re diving into it a bit here to show how the math can be used in setting objectives for latency budgets in back end systems.
Note that if you can give partial results to users before all the back end responses are in, great! You’re well on your way to mitigating the long tail.
Also note that this post does not discuss setting user level SLOs or SLAs. There are many resources available that discuss this and it’s more of a business or marketing related issue. This post sheds some light on what objectives are necessary from the back end to support whatever user level objectives have already been decided.
TL;DR
Once you’ve determined the SLO or SLAs for the user experience, you can derive what is required from the back end to support it. Let’s say that you determine that the user requests should meet the SLO target 95% of the time (whatever the target is). If the service accesses 50 back end systems to service the requests, then they will need at least 3 nines of probability of hitting the target. If it accesses 500 systems, then 4 nines of probability of hitting the target SLO will be required.

..or simply:

..where SLA represents the customer facing objective/agreement, N is the fanout for back end services and SLO is the objective for each of the back end services.
You can calculate this from the command line with “bc -l” or use your favourite calculator..
scale=4
e( l(0.95) / 50 )
.9990

scale=5
e( l(0.95) / 500 )
.99990
Quick Probabilities Refresher


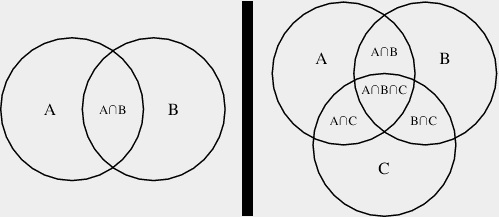
As an exaggerated case, if we have two systems that fail SLO with a probability of 0.5 (they each fail half the time), then the combined failure probability will be given by the following union of events.

It doesn’t matter if only one fails or both fail, the overall user experience will be a fail. However, we only want to count the overlap once, so need to subtract out the area of intersection. Obviously, in this exaggerated case, (like coin tosses), the user experience would fail SLO 75% of the time.
0.75 = 0.5 + 0.5 - 0.25
Where it gets “interesting”, is if you have dozens or hundreds of services that must respond before the deadline of the SLO. It would be a combination explosion to calculate this way as we can start to see from the diagram on right with only 3 services.
It’s easier to find the intersection set of the inverse probabilities; the probability that they will each succeed in meeting the SLO. (This is also generally easier to glean from available data.) Assuming that the events are independent, the probability of both succeeding is simply multiplying the success rates to get the overall success rate. In our simplified extreme example above the user would experience SLO success 25% of the time, 0.5^2.

It’s the intersection set of when they both succeed. Subtract from one to find the failure rate. Much easier to calculate.
Setting SLO for Backend Systems
Assuming that all the back end services are equal and independent[2], we can use the same method to come up with a rough objective budget for back end services using probabilities.
Using a real example from my past, I’ll look at the objectives for the back end as well as a mitigation strategy for improving the customer experience.
The system had thousands of lucene index applications in the back end which consumed most of the SLO budget. Requests could contain hundreds of terms and hit many hundreds of these apps for the larger customers. All queries must complete before the response is sent to the user. The target SLO (as well as SLA for some customers) was 90% of the queries finishing in under 20 seconds.
We rarely had trouble with smaller customers as the queries would only be hitting a few dozen back end systems. Using the formulae above, 3 “nines” or 99.9% objective for the back end systems meeting their latency budget would suffice. Larger customers might fan the query out to 500+ systems. Meeting the customer SLO would require 4 “nines” or 99.99% from the back end which was always a “challenge”.
Improving the “average response times” wasn’t going to make much of a difference of course. 95% of the responses from the back end were available within half the SLO budget for the back end already. It was the outliers that killed us and they were unpredictable. “Noisy neighbour”, “garbage collection” and other events that would always be a factor and wouldn’t go away by improving average performance.
The paper alludes to a solution with “Hedged requests”; sending the same request to multiple replicas. Unfortunately, the simplest scenario would double the traffic and make “noisy neighbour” issues even more prevalent.
The paper also mentions deferring the secondary requests. This starts to make sense. Since 95% of the requests were returned in half the time budget, for 500 systems we’d generally only need to send out about 25 requests to the replicas. We’d already established that 95% of the systems responded in 10 seconds, so most of the time the remaining 25 systems would respond in the remaining 10 seconds to meet the overall SLO of 20 seconds.
Summary
If you haven’t already, read the Tail at Scale[1] paper and Adrian Colyer’s[3] notes on it.
Understand that there are always going to be variances and the best way to model the performance for a large fanout of back end systems is by using probabilities.
Probably.
[1] The Tail at Scale Dean and Barroso 2013
[2] Never really true actually, but close enough for estimating.
[3] the morning paper Adrian Colyer
3 thoughts on “The Tail at Scale”
Comments are closed.