
My last article discussed some of the missing math related to setting back-end objectives. This article presents a chart which is useful in understanding the relationship to the user experience and we examine ways to dramatically improve the overall performance.
Please read the previous article if you haven’t already. It includes a link to the original brilliant paper and provides more background. The graph included in this article hopefully is a more useful, actionable tool in developing or refining objectives and seeing the relationships between backend performance and customer experience.
The paper also discusses mitigation techniques and we’ll demonstrate how amazingly effective they are in improving the user experience.
Assumptions
The relationships discussed are SLI (service level indicator) agnostic. While they may be most useful in developing latency time budgets for the back-end, it can also be used in looking at other indicators such as availability or error service levels.
The only requirement really is that there are a significant number of measurements; that the back-end responses are relatively independent and that the back end systems and responses are relatively the same. (Never entirely true, but the calculations here get us in the ballpark and are useful guidelines anyway.)
The Chart
Service levels are often described as a percentage of success to meet objectives. They can also be described as the reciprocal of failure rates and we’ll show both in the following graphs. For example, an SLO of 75% would be a failure rate of 25% or 1/4 and the reciprocal would be shown as “4” along the left side of the chart.
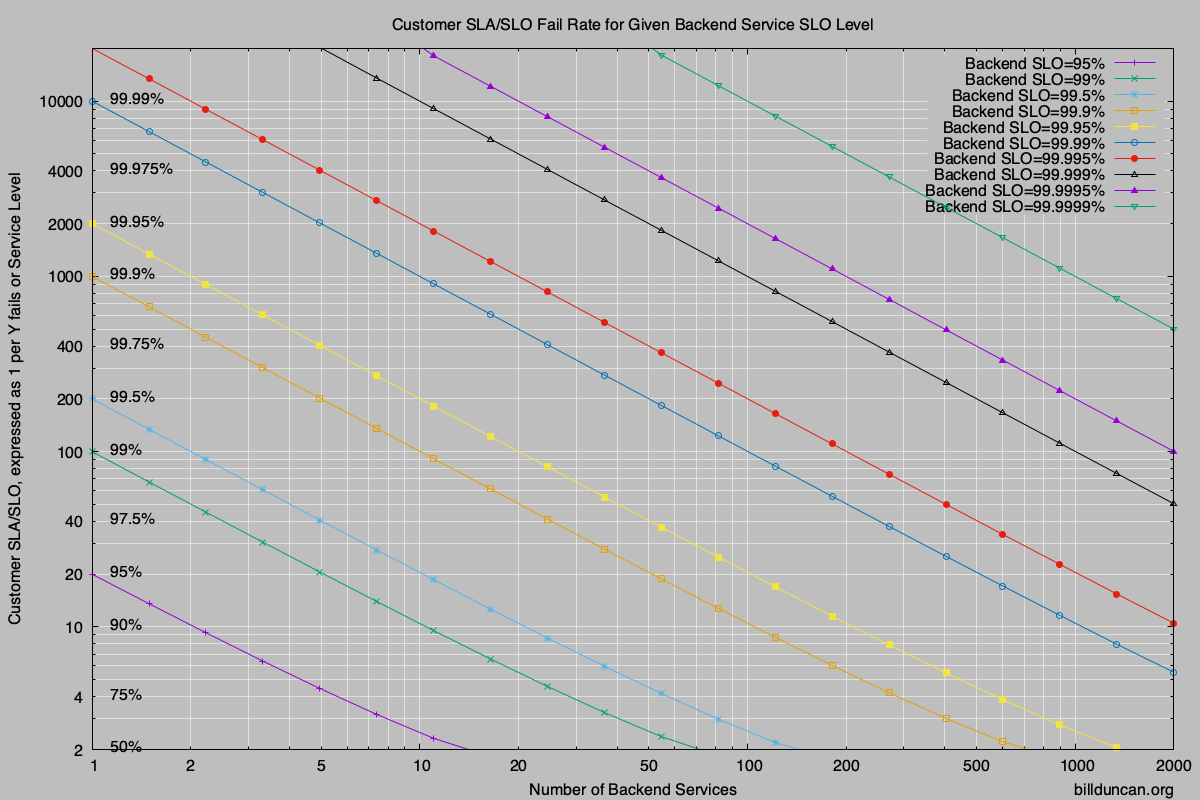
(A PDF version of the chart is here.. PDF_Chart.)
The diagonal lines represent different service levels for each of the services in the backend. The number of services is along the bottom. To use the graph, pick any two of the variables and look up the third.
The calculations can obviously be done programmatically, but the chart is useful in seeing the sensitivity to changing the variables and doing what-if calculations while defining or refining your SLOs.
An Example
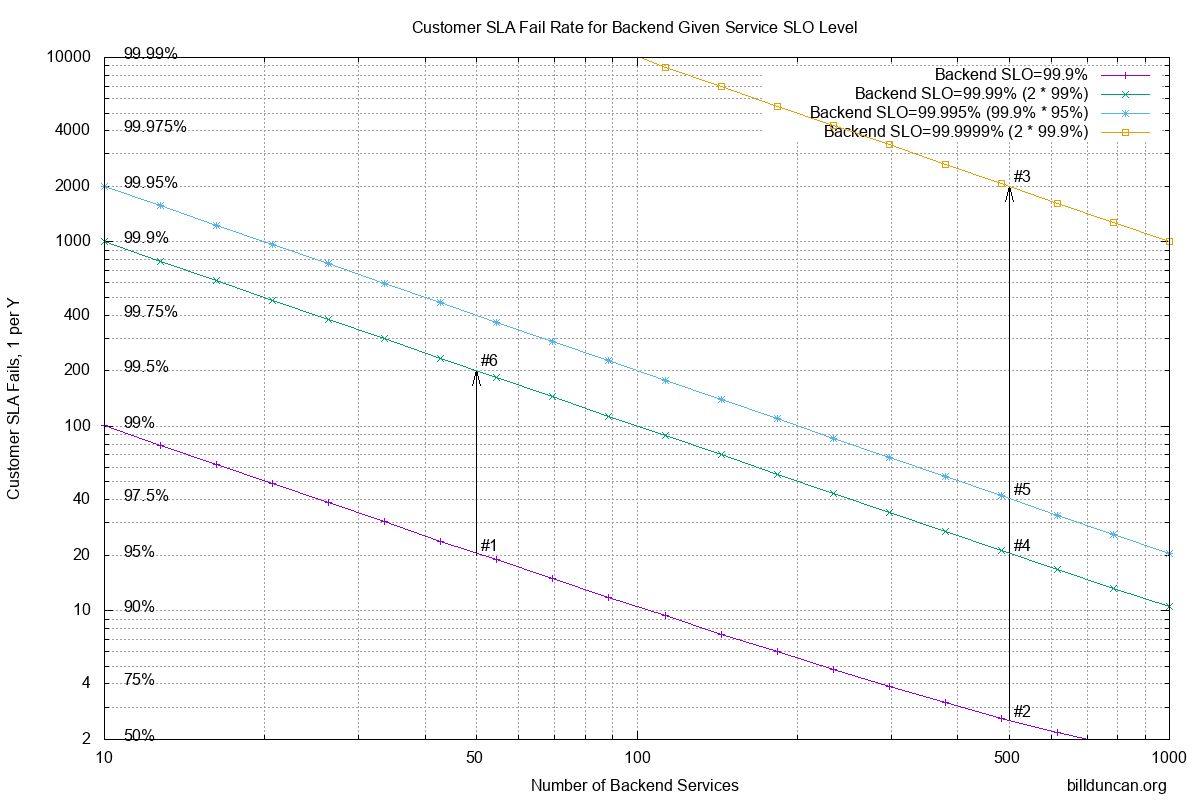
In my previous article I described a situation which was close to what I’d seen in the past. We’ll work through a similar example using a modified version of the chart to make it easier to describe.
To recap, we were achieving somewhere around 99.9% service level in each of the backend services. We had SLAs for some customers at the 90% level for latencies (it doesn’t matter what they were for this discussion). Obviously we wanted to do better than that to give us a buffer, so we’ll pick 95% as our internal SLO (objective) for the customer experience.
The smaller customers would be hitting maybe a few dozen services, usually less than 50. The #1 marker in the chart along the bottom diagonal line for 99.9% backend SLO shows that we’re cool at this point. However as we move across to 500 systems for the larger clients, the customer experience sucks (becomes around 61% shown with marker #2).
To achieve our customer objective with 500 systems would require 4 nines, or 99.99% service level from the backend services as shown in #4. Ouch!
Mitigation
We were struggling to provide a service level of 3 nines in the backend. How would we accomplish 4 nines?!?
If we send the requests off to both replicas of each service, the success level increases dramatically. Using probability, most of the time (99.9%) the services will succeed. To calculate what happens when we contact two systems for each service, we need to find the intersection set of the inverse, when both systems in a service fails. They both fail at a rate of 1 in 1000. Square it and we get a failure rate of 1 in a million or 99.9999% success rate as shown with marker #3. That corresponds to a customer SLO/SLA rate of just one failure in 2000, or 99.95% !!
In fact, if we contact both replicas for each service, we can relax backend requirements to only 99% to get a combined 99.99%, to achieve our desired 95% customer SLO/SLA (as shown with marker #4 again).
Deferred
Possibly a better approach in some circumstances is to defer requests going out to the second replicas. Given the long tail of request latency outliers, we were finding that roughly 95% of the responses were completed by the backend in half the time budget. So, if we waited until half time to send requests out to the replicas, we’d only need to send them out to about 5% of the replicas and we’d get responses back from them at a success rate of about 95%. (We might also get the original requests back during that time, but we’d just throw away duplicate responses.)
Calculating the probability for this, we again use the inverse; the probability of both replicas failing. Multiplying out we have 1/1000 * 1/20 to get a combined failure rate of 1/20,000 or success rate of 99.995%. Better than 4 nines!!
Looking at marker #5, we can see that it corresponds to a customer service level of 97.5% or only 1 in 40 requests failing the objective with the large clients. More than enough headroom for the actual 90% SLAs and even some buffer available with our internal 95% SLO to account for growth to a thousand systems. Bonus is that smaller customers will achieve happiness at better than 99.75% of the time (marker #6)
Conclusion
Hopefully the chart will give you a better understanding of the relationship between customer SLO and backend SLO rates. It may be a starting point in understanding and discussing the service rates with engineering and support; what is desirable vs. what is possible. Print out the PDF_Chart and pass it around when discussing updates to the SLO.
Most of all, it hopefully demonstrates how involving replicas in the backend requests dramatically improves the user experience and/or relaxes the requirements for the backend.
Of course, all of this depends on specific circumstances with regard to other interactions and dependencies in your systems. YMMV, but may serve for setting guidelines with a better understanding. Leave yourself a margin in communicating objectives with customers and read the relevant chapters for setting SLO in the Google Books. Also remember that the time budget for the backend systems may be significantly less than the frontend SLO target.
Good luck!
If there are any calculator geeks around, I wrote a small program for the HP-41C programmable calculator and have uploaded it here: https://www.hpmuseum.org/forum/thread-15091.html
Close enough for horseshoes..
For every order of magnitude of number of systems, you need an order of magnitude better reliability in the backend.
eg. If you need one nine (90%) as your objective.. Your backend will need better than one nine with one system, two nines at 10 systems, three nines at 100 systems, four nines at 1000…
Another quick estimator.. If you involve two replicas for each service in the backend, you double the number of nines. eg. If you have 99% service level for backend services, hitting both replicas for the services would effectively be 99.99%. Three nines will give you six etc. If the last digit is greater than 7, add an additional nine. eg. 99.7% would be like five nines.